Sore legs after conquering the hills in Nijmegen? This makes perfect sense. Learn how muscle oxygen data explains why your legs feel the way they feel after a hilly race.
De Zevenheuvelenloop
Last week thousands of athletes conquered the autumn classic running race, ‘the Seven Hills Run’, or in Dutch ‘De Zevenheuvelenloop’. In contrast to popular belief, we actually have hills here in the Netherlands.
Strangely enough, the race carries you over 6 hills, the name is actually derived from the iconic ‘Seven Hills Road’ or ‘Zevenheuvelenweg’, one of the toughest sections of the race in the 8th and 9th kilometer. Afterward, you’re treated to a smooth downhill kilometer followed by the hardest kilometer of the day. Okay… maybe we’re exaggerating, with only 20m of climbing this kilometer averages an ascent of 2%. The Netherlands truly is a pancake-flat country.
A total of 140 meters of elevation is no limitation for the world’s fastest athletes to run crazy fast times, the world’s fastest 15km (41:05) was actually run in 2018 by none other than Joshua Cheptegei on this exact course.
The data
This race weekend traditionally starts Saturday evening with the kids’ run and the night race. One of our athletes ran the night race over 7 kilometers. The shown data is from a 27-year-old male, 1m85, +/- 70kg, he is a recreational runner that is into functional fitness as well.
In the first graph we see the pace of the athlete:

A solid performance that resulted in a personal best and finish place with the fastest female athletes. Perceived effort? Intense. Something that is fully backed-up by his heart rate data:

Averaging 187 beats per minute over the course of almost 24 minutes. Right from the gun the heart rate shoots up and stays there for the rest of the race. Typically, you would conclude that the effort throughout the race was constant, the athlete was steadily expanding their energy until the finish.
This is actually not the case; the hills add another component that you have to force. This is not visible in the heart rate data because the hills are tackled by one part of your body in particular, your upper leg!
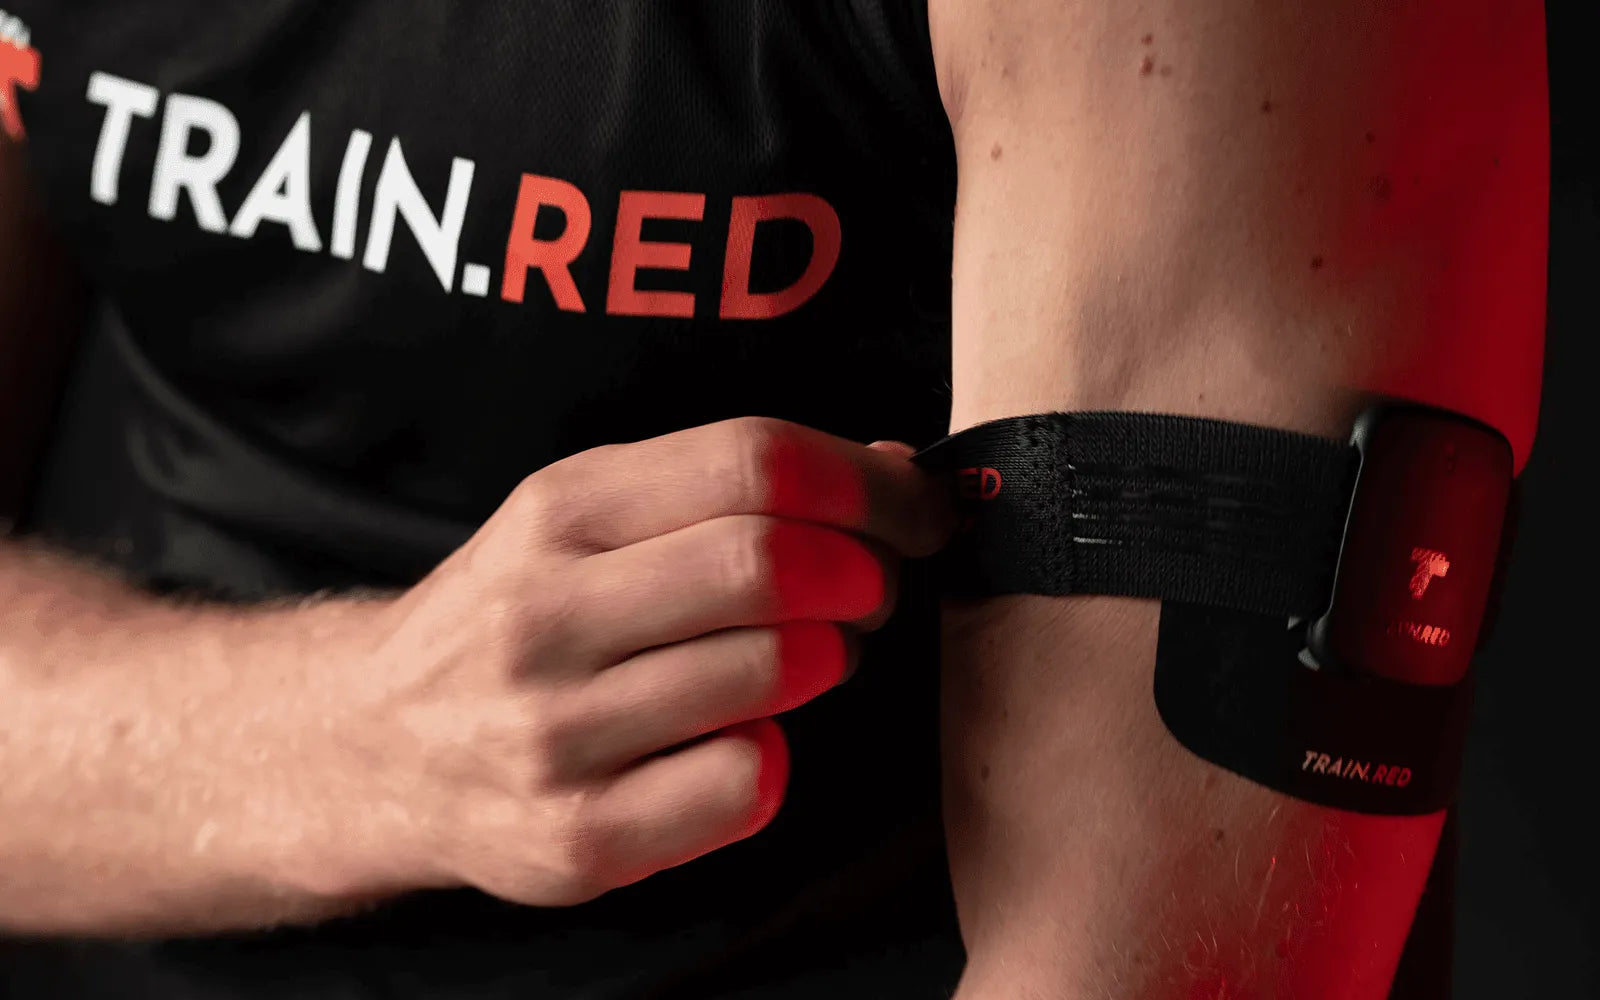
Your heart rate is a very good indicator of global exercise intensity, it shows how hard your full body is working but when running uphill, it is primarily the upper leg that compensates for the increased resistance. When you place the Train.Red FYER on the upper leg muscle, more specifically the muscle belly of the m. rectus femoris, the middle string of your quadricep, we can accurately measure how hard the legs were working!

Notice how the elevation and oxygenation are almost exact opposites! However, there are naturally clear differences if we zoom in on specific sections. Let’s go over this data chronologically:
Bang! Right from the start, we observe desaturation. A proper warm-up led to a high oxygen saturation in the athlete’s leg, but the moment he starts racing we can see that the leg demands a high amount of oxygen. This demand for oxygen spikes up the heart rate, which interestingly enough, doesn’t come back the entire race. The oxygen trace flattens out over the first kilometer, comparing this with the speed, this makes perfect sense, the athlete is settling in, and running at a pace he should be able to maintain for at least 6 more kilometers.
The first hill at kilometer 2 is where it becomes interesting, as soon as the slope goes up, we see the response in the muscle, an initial dip in oxygen, followed by a gradual increase. Linking back to the speed graph of this athlete, we also see the foot is taken off the gas approximately 200m into this part of the race. When the hill flattens out for a very brief moment at km 3, the speed shoots back up, which is immediately visible in the muscle as well. The following ascend, descend, and ascent shows the trend you’d expect to see in the muscle. When running uphill, the strength component increases, when running downhill your muscle can ‘recover’. Among trail runners, however, it is not uncommon to complain about the extreme muscle soreness you can get from downhill running. This is due to the increased eccentric contractions you create when absorbing the landing. These eccentric contractions however do not consume as much oxygen as your concentric contractions as shown by the oxygenated state of the muscle in the graph above.
The last 2,5 km is exactly that, running downhill. Notice how the heart rate still remains an almost stable trace, whereas the oxygenation is at its maximum level since the start of the race. The perfect starting point for a tempo effort until the finish. The athlete picked up the speed once again and we observe a gradual decrease in oxygenation. The home stretch is where we see some fluctuation as a result of pace differences, and a very tough sprint finish. Maybe not a sprint when we observe the pace, but definitely a sprint when we incorporate the fact this is actually not flat, but slightly uphill again. The athlete dipped just below the initially self-predicted time in a new personal best, so all smiles after all the lactate was cleared.
Comparing athletes
Continuing the race weekend on Sunday where two athletes joined the 15km road race. They are both trained runners, male, 25-35 years old, and not the best nor the worst in the field. Comparing their splits against Beatrice Chepkoech (female winner), Rogers Kibet (male winner), and the average of all 14391 finishers of the 15 km, we see that athlete 2 represents an above-average runner and athlete 3 is just short of the fastest female in the race.

Both athletes wore the Train.Red FYER sensor on their right leg, and show a very similar oxygenation trend over the 15 km.

This trend is way better visible when the data is normalized along the y-axis.

Again, this trend closely follows the elevation profile, let’s have an in-depth look at their races!
Coming from a similar level of oxygenation, it is clear that athlete 3 shows a more distinct desaturation right from the start. During the race, the average value is lower, and the overall amplitude of the trace is more pronounced, but it is the trends of the data we are interested in!
Athlete 2 seems to settle in at the right pace slightly faster than athlete 3, this might be explained by the fact there is a bit more of a fight for positions at the higher level. As soon as the hills start, the muscles respond.
An interesting dip at km 5 for athlete 3 shows the influence of a small acceleration after a corner, something we typically see in cycling races. The Zevenheuvelenstraat from kilometers 7 to 9 took its toll on both athletes, a bill that is presumably paid between kilometers 10 and 11. Very pronounced oxygenation changes from km 7 to 9 and not a lot of recovery during the fastest km of the course, the downhill section towards km 10.
Especially athlete 2 seems to have taken it a bit easier on the toughest km of the day, km 11. The pace dropped significantly whereas the oxygenation remained fairly stable, the perfect pacing strategy or is there more left in the tank?
The last 4 km’s are fairly similar for both athletes again, smoothly rolling back into the city center of Nijmegen. A close dissection does show a slightly different pacing strategy for the two athletes, athlete 2 fully empties the tank in the last km, whereas athlete 3 does not really seem to push everything out. Is that a result of the difference in athlete's level, or is mental resistance related?


Do hills really pay the bills? Hard to tell with just heart rate data, but this race day data shows exactly why hills add such an extra burden. Use this information to your advantage during training, and come best prepared with physiological insights, directly from your muscle!


