Cycling is increasing in popularity not just among fans of the ‘Tour’ or ‘La Vuelta’ (read this blog) as well as in the number of athletes involved worldwide. If you are a cyclist yourself, and you aim to improve your performance, it is essential to perform assessment tests. "Why" you ask? These tests or assessments have various purposes, including:
- Identifying the physiological/performance model
- Monitoring the evolution of the athletes' performance
- Defining training intensities and pacing strategies
- Evaluating the effects of your training program

Incremental ramp test
In this blog, we focus on 'how to use' Train.Red sensors and NIRS data during an Incremental Ramp test. This will allow you to understand your athletic condition and adapt your training to get the KOM on that impossible climb or to save more energy for the final sprint in your goal race of the season.
Measuring muscle oxygen allows us to have an in-depth view of what happens inside our muscles during exercise.
The first indicator to consider is Muscle Oxygen (SmO2%), which gives you information about the ratio between oxygen delivery and oxygen consumption in the muscle. And it's variations reflect various metabolic situations of our muscles.
I’m in! What’s next?
A test used in the literature that has proven to be valid, accurate, and repeatable is the incremental ramp test (RI test). It is easy to implement and widely used by athletes and trainers, you can follow this same protocol on Zwift or with another training application or even ride your bike on the road (find a way with a smooth gradient, without interruptions, and with little traffic: safety first!).
The test protocol is as follows:

Step 1: warming-up
Start with a 5 minutes warm-up so you can reach your full potential during the test. It is important that it is intense to prepare the body for exercise, without affecting energy reserves. Use our ‘Supply&Demand’ feature to guide your warming-up. Tip: try to keep a balance between the supply and demand of oxygen during the whole warming up. After the warm-up make sure you are mentally ready to start the test.
Step 2: start the test
Then, the test starts with the first step at 100 W.
After this phase, the load increases by 20 W each minute until physical exhaustion is reached and it will no longer be possible to continue the exercise. The pedaling cadence must remain in a range between 70 and 100 rpm, when it is no longer possible to remain in this range for more than 3 seconds, the test is concluded. Even though we have used this protocol, other similar but different protocols can also be used.
After the test, use this period as an active cool-down, by keeping pedaling and to help your body return to normality.
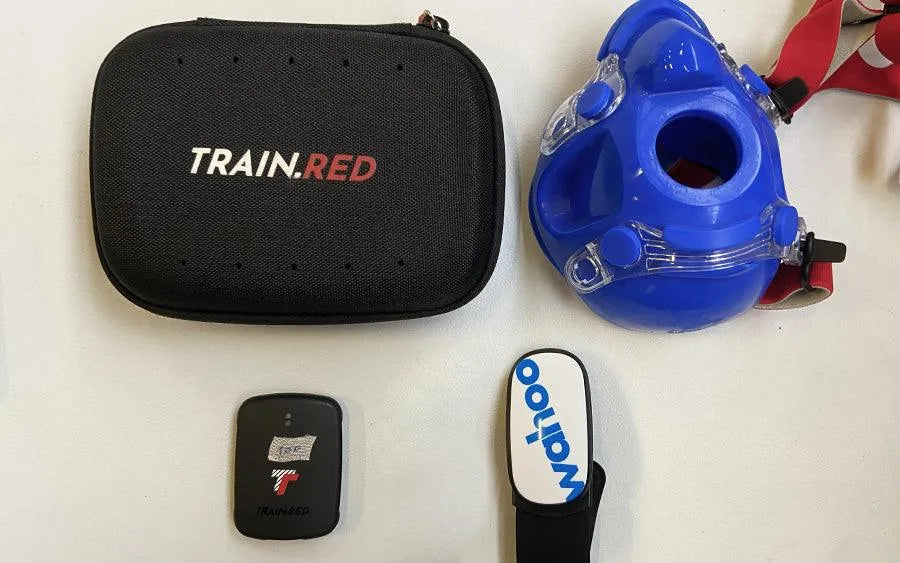
Where do you position the Train.Red sensor?
Evaluate the relationship between oxygen delivery and consumption directly, by placing the Train.Red sensor on the active muscle (eg. vastus lateralis and/or rectus femoris). Position the sensor on a reference muscle that is not directly involved in the exercise (e.g. the deltoid) to indicate how the exercise affects systemic circulation and the level of oxygenated blood arriving in the muscles.

With multiple muscle oxygen sensors at once, you can have further important indications to reach the highest possible level.
Two sensors on symmetrical muscles (e.g. right and left vastus lateralis) enable the opportunity to evaluate whether the consumption of muscle oxygen is in balance. Observe the possible intervention in one leg or the presence of some alteration of the blood flow inside the limbs.
NOTE: differences in the absolute values of SmO2% or of other variables do not necessarily indicate the presence of differences or problems in the limbs. If these differences do not exceed approximately 10%, they may be due to a different conformation of the underlying tissues that alter the measurement. For this reason, it is essential to analyze the kinetics of the various components rather than the absolute value to draw our conclusions.
What happens in your muscles?
The SmO2% trend in 3 phases:
1st Phase: A match between oxygen delivery and consumption while the SmO2% value remains constant or drops slightly.
2nd Phase: our body's ability to carry blood is no longer compensated for by oxygen demands and the SmO2% value drops rapidly.
3rd Phase: the muscle cannot extract oxygen faster than what is being transported by the blood, and the SmO2% value stabilizes at a much lower level than the starting one. This trend can be explained by the intervention of fast muscle fibers, which have a predominantly anaerobic metabolism.

Through mathematical analysis, it is possible to determine the exact points of this trend reversal (the break-points: SmO2% Break-Point 1 and SmO2% Break-Point 2), but they can also be identified through visual analysis. It is necessary to underline how due to the peculiarities of each subject these points can be more or less clear and easy to recognize.
Understanding SmO2% ‘Break-Points’
By evaluating the 'Break-Points', it is possible to obtain a clear indication of the athlete's fitness status. It also enables the trainer to keep track of improvements during a training period. With improved performance, the 2nd SmO2% Break-Point occurs at a higher workload during the Ramp Incremental test.
Once these points have been obtained, it is possible to divide the intensity into three main training zones to optimize the physiological aspects of the training by reducing the risk of error caused by daily physiological variations.
In training or competition, it will be possible to adapt our power output based on the responses of the muscle by choosing the right pacing strategy so as not to run out of energy too soon or without having expressed all one's potential.
Finally, the 2nd breakpoint could be used as an analog of FTP to determine the power zones for our training, however, we must pay close attention because, although they are related, they are not the same and could lead us to use slightly incorrect power zones.
As with VO2 measurements, it must be remembered that altitude and excessive heat could lead to shifts in the reference values caused by the adaptations implemented by the body, and for this reason, it is advisable to modify our response based on individual responses.
COACH TIP: if during the warm-up phases or in the first part of the race the SmO2% values could suggest a poorer performance (SmO2% is lower than usual at the same workload or the amplitude between maximum and minimum SmO2% is less pronounced), don't panic. The values indicate what is happening at that exact moment and help us modulate our activity, but they do not reveal whether our body will be able to unleash its maximum potential at a later time. It is a common fact that on some days we feel tired, with sore legs and think that we are having a bad day and then carry out a training or a competition with results never seen before.
IN SHORT
Train.Red turns out to be a new metric for endurance sports. It comfortably allows us to have an internal load value, unlike the power which during training and competition reflects an external load index. It allows us to adapt to any situation by implementing the best response to optimize our performance and has excellent sensitivity to detect fatigue after several hours of activity.
Train.Red is at the forefront of using this new metric and in the future, we expect to find new opportunities and discoveries to share with our sports fans.